

EMA Cloud Trading Chart Add-On
The EMA Cloud is fully adjustable to any EMA length. So whether your day trading with a 21 EMA or Swing Trading with an 89 EMA, traders can adjust the inputs to suit. Traders can even adjust colours so that they can load up more than one EMA Cloud on their chart.
TRADE LIKE A PRO
WAS $99 - NOW ONLY $29!

INTRODUCING THE EMA CLOUD INDICATOR
EMA Cloud Indicator
Generally, traders use Exponential Moving Averages (EMAs) with other indicators/software to determine the market’s trend. We also use the EMAs to gauge the validity of our suspicion when trading fast-moving markets. Some traders even use them to determine the market’s BIAS.
But with The EMA Cloud trading chart add-on for NinjaTrader, we can do more than that. With this customized EMA indicator, we can spot all the entry points and trailing stops.
What Is The EMA Cloud trading chart add-on
The EMA Cloud trading chart add-on for NinjaTrader helps traders spot trailing stop positions and entry points.
Fortunately, you can easily adjust the Cloud to your favorite EMA length and still get great results. Therefore, whether you’re swing trading using an 89 EMA or day trading with 21 EMA, you can adjust it to fit your strategy.
If you want to use more than 1 EMA, you can adjust its color to help with visualization. The EMA Cloud trading chart add-on for NinjaTrader can help you manage trades when dealing with these financial instruments:
Cryptocurrencies
Futures
Stocks
Forex
Commodities
How Does The EMA Cloud trading chart add-on
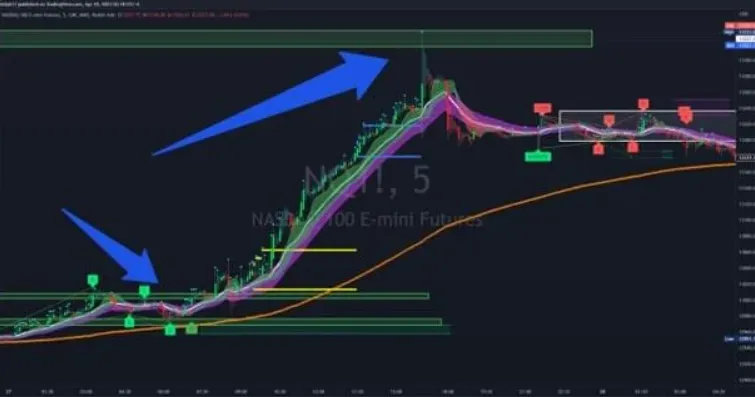
Generally, this tool functions as a bluish cloud on your chart, with most traders preferring 34 EMA. 34 EMA is a more conservative EMA for this cloud trading indicator. When the market is neutral, most of the candlesticks form inside or near the cloud, which serves as the resistance.
But when the market’s sentiment changes to bearish, then it will start dropping outside the cloud. So you can wait for the second candle, which serves as a confirmation, and enter the market. Luckily, our system will show you the entry point, which is usually pointed with a yellow arrow.
If it’s a bearish market, the price will drop once it reaches the resistance and start ranging or trending upwards. Unlike most systems, our indicator will even show you when to exit a position and take a profit. All you have to do is watch out for when the candlesticks get back into the cloud.
Remember, the EMA cloud is the resistance, so when looking for an entry, you should look at how it holds. The yellow arrow indicating an entry point shows after the price breaks through the resistance. On top of that, the take-profit position is near the cloud or as soon as the price returns back to the resistance.

Who Am I?
Hi — I'm Paul Bratby, a former British Army soldier who turned a challenging life into a successful trading career.

Meet Paul Bratby
Hi, I'm Paul Bratby. My journey from navigating the challenges of everyday life to mastering the trading arena is one of dedication, innovation, and success.
I discovered the world of trading and investing early in my career, where my disciplined approach and analytical mindset quickly transformed my trading endeavors into remarkable success. This set the stage for a distinguished career in the financial markets.
Today, as the founder of Global Trading Software, I develop a collection of tailored trading indicators that cater to traders of all kinds, making sophisticated trading methods accessible and empowering traders to achieve consistent success.
I'm also deeply committed to education, conducting regular training sessions and live webinars where I share market insights and strategies. My teaching emphasizes disciplined trading and recognizing market confluence, equipping traders with the skills they need to succeed.
Additionally, I authored "Confluence not Coincidence", a book that delves into the critical concept of market confluence, offering traders a roadmap to recognize and capitalize on converging signals.
Click here to get your copy of "Confluence not Coincidence" and gain invaluable insights from a veteran trader.

Don’t just take my word for it…
See what others have to say about us:
Its been a crazy week, after microsoft earnings and the way nas closed on Wednesday with such a bullish move I was really bullish on the nas so I was just looking for longs, on thursday morning in the premarket and I had a monster trade. Caught a six star buy breaking the c pivot of a bat pattern. My stop was below the d pivot. I held it until the close for over 300 points. It just ran best trade I have ever had.
— Pedro E
“There is no magic bullet in trading, but the products offered by GTS are the closest things to it. They give you a great framework from which you can build on, whether you are just starting out or if you already have experience and are looking for another edge.”
— Tom, GTS Client
“Within a few weeks, I was hitting my weekly targets days on Mondays and Tuesdays some weeks instead of Fridays!”
— Nathan Shephard, CEO, Southern Sky Recovery
“Yes, I have made mistakes and losses, but that is the nature of the beast so to speak. However, the software does exactly what it says on the box and even with my limited knowledge, and with a bit of a learning curve, i am getting results.
I’ve had other software packages from various companies in the past which worked, but for me personally, this package ticks all the boxes.”
— John Davies, GTS Client
Scroll
Risk Disclosure:
Futures and forex trading contains substantial risk and is not for every investor. An investor could potentially lose all or more than the initial investment. Risk capital is money that can be lost without jeopardizing ones’ financial security or life style. Only risk capital should be used for trading and only those with sufficient risk capital should consider trading. Past performance is not necessarily indicative of future results.
Hypothetical Performance Disclosure:
Hypothetical performance results have many inherent limitations, some of which are described below. No representation is being made that any account will or is likely to achieve profits or losses similar to those shown; in fact, there are frequently sharp differences between hypothetical performance results and the actual results subsequently achieved by any particular trading program. One of the limitations of hypothetical performance results is that they are generally prepared with the benefit of hindsight. In addition, hypothetical trading does not involve financial risk, and no hypothetical trading record can completely account for the impact of financial risk of actual trading. for example, the ability to withstand losses or to adhere to a particular trading program in spite of trading losses are material points which can also adversely affect actual trading results. There are numerous other factors related to the markets in general or to the implementation of any specific trading program which cannot be fully accounted for in the preparation of hypothetical performance results and all which can adversely affect trading results.

Copyright © 2024 Global Trading Software. All Rights Reserved
Terms of Services | Privacy Policy | Cookie Policy | Risk & Hypothetical Performance Disclosures