

Auto Harmonic Pattern Recognition Trading
The Auto Harmonic Pattern recognition software is designed to take the heavy lifting out of a traders Harmonic trading strategy. The Software automatically Identifies and Projects Harmonic Pattern Completion Zones for the 6 most trade-able Harmonic Patterns. Please view the chart images on the left to help visualize how simple we have made Harmonic Pattern Trading for both Long and Short trades…
BEFORE $999
TRADE LIKE A PRO ONLY $499

INTRODUCING THE AUTO HARMONICS INDICATOR
Auto Harmonic Pattern Recognition Trading
Anticipate future price trends by analyzing chart patterns using accurate calculations. Using an indicator for all your technical analysis is one of the best strategies for day and swing traders.
Consequently, you want a trading indicator that analyzes most, if not all, common chart patterns. That’s where the Auto Harmonic Pattern Recognition Trading comes in. It’s an innovative indicator that analyzes various common Harmonic patterns. In addition, it has an intuitive interface that’s navigable even for beginners.
Harmonic Patterns to Analyze with Auto Harmonic Pattern Recognition Indicator
Eliminate the tedious manual analysis process and utilize an accurate indicator that recognizes most Harmonic patterns. The Auto Harmonic Pattern Recognition Trading identifies these patterns fast, unlike when done manually.
It’s precise and goes over more chart data than the naked eye. After identifying the Harmonic patterns, this indicator projects their completion zone. As such, it allows you to make better trade decisions.
Relying on this indicator is one of the best strategies for beginners. It eases your workload and gives accurate information about price fluctuations.
Further, such information is reliable when selecting entry and stop loss points. It’s cumbersome to go through every chart pattern and learn Fibonacci ratios.
Hence, use this indicator for expert analysis. You’ll have more time to read company reports and other news and learn about your investments.
This indicator helps you track and analyze Bat, Deep Crab, Alternate Bat, Gartley, Butterfly, and Crab patterns. These patterns are regular and consistent. Plus, you can use them alongside other indicator theories.
Auto Harmonic Pattern Recognition Trading Instruments
This indicator forecasts possible price movements for a variety of financial instruments. These include stocks, forex, crypto, commodities, and futures. Experts and beginners alike use Harmonic patterns for such analyses.
Since Harmonic patterns are either bullish or bearish, you want to know the precise movement to enter or exit a trade. Consequently, this indicator gives you objective judgments. The data comes from the Fibonacci ratios. You’ll see these patterns highlighted in colorful candlesticks.
On top of that, using it helps you analyze more instruments faster. It’s a great idea to do such automatic analysis when you have a diverse portfolio.
The harmonic pattern indicator also predicts the length of price movements, which gives you time to plan your investment. Use it to track instruments you’re interested in but too cautious to invest in.
After studying the patterns for a while, you’ll see whether it’s worth spending your resources on those instruments.
How Does The EMA Cloud trading chart add-on
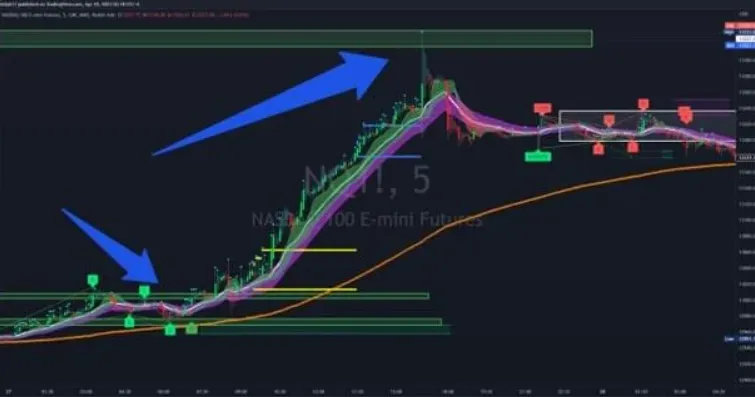
Generally, this tool functions as a bluish cloud on your chart, with most traders preferring 34 EMA. 34 EMA is a more conservative EMA for this cloud trading indicator. When the market is neutral, most of the candlesticks form inside or near the cloud, which serves as the resistance.
But when the market’s sentiment changes to bearish, then it will start dropping outside the cloud. So you can wait for the second candle, which serves as a confirmation, and enter the market. Luckily, our system will show you the entry point, which is usually pointed with a yellow arrow.
If it’s a bearish market, the price will drop once it reaches the resistance and start ranging or trending upwards. Unlike most systems, our indicator will even show you when to exit a position and take a profit. All you have to do is watch out for when the candlesticks get back into the cloud.
Remember, the EMA cloud is the resistance, so when looking for an entry, you should look at how it holds. The yellow arrow indicating an entry point shows after the price breaks through the resistance. On top of that, the take-profit position is near the cloud or as soon as the price returns back to the resistance.
Harmonic Patterns:
ALTERNATE BAT
BAT
BUTTERFLY
CRAB
DEEP CRAB
GARTLEY

Who Am I?
Hi — I'm Paul Bratby, a former British Army soldier who turned a challenging life into a successful trading career.

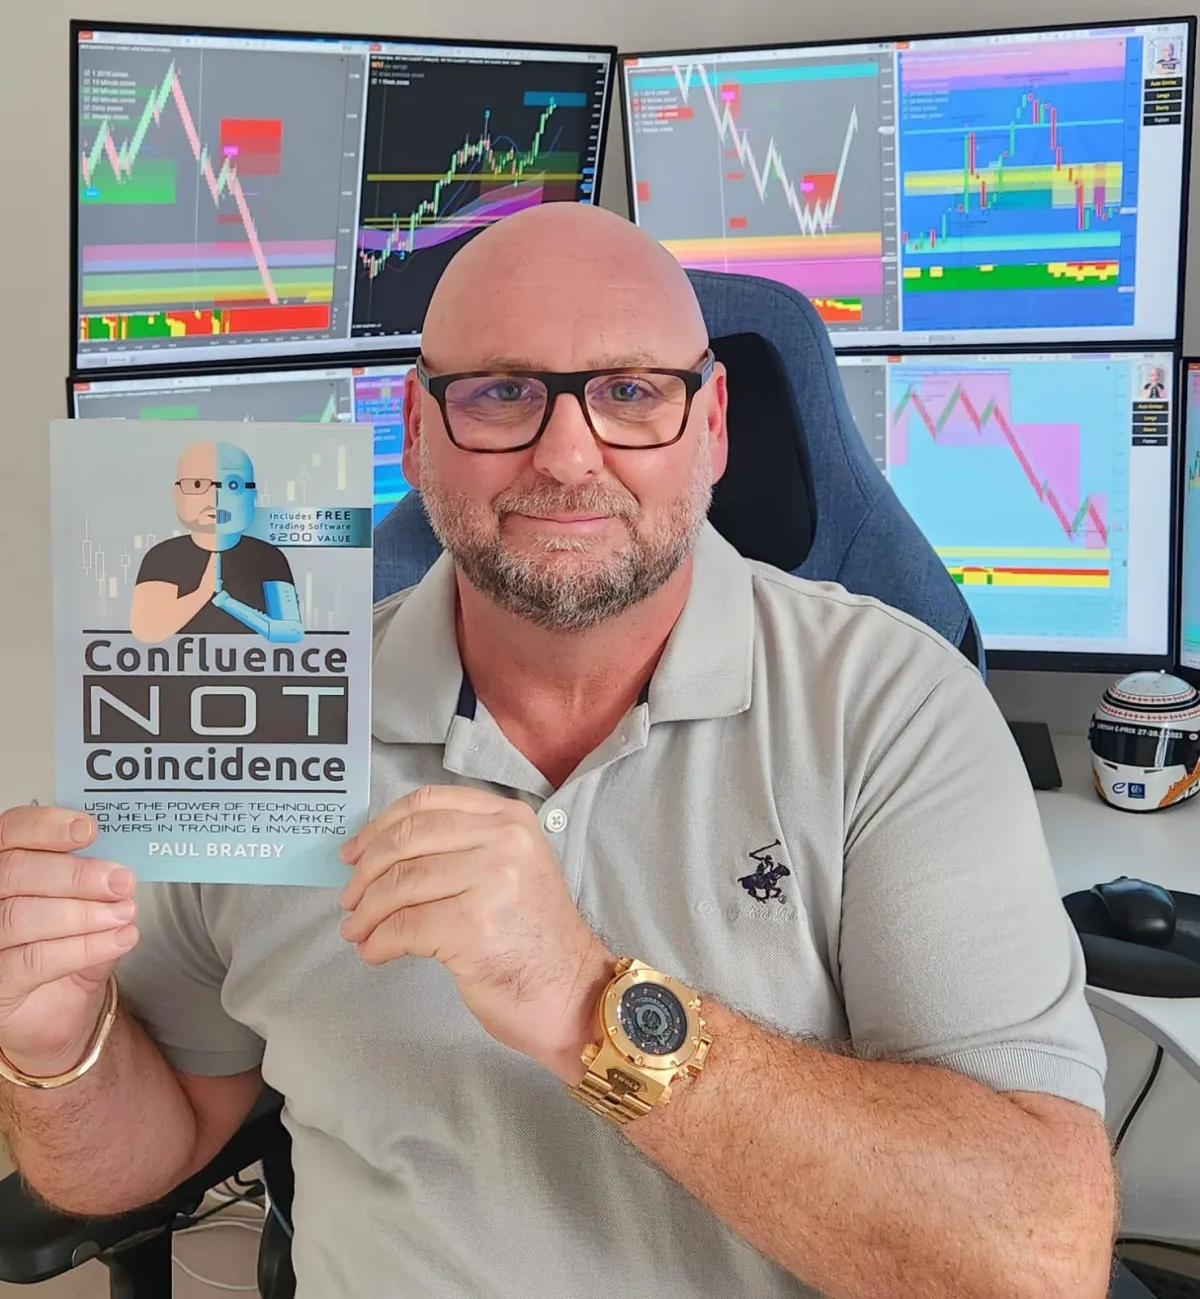
Meet Paul Bratby
Hi, I'm Paul Bratby. My journey from navigating the challenges of everyday life to mastering the trading arena is one of dedication, innovation, and success.
I discovered the world of trading and investing early in my career, where my disciplined approach and analytical mindset quickly transformed my trading endeavors into remarkable success. This set the stage for a distinguished career in the financial markets.
Today, as the founder of Global Trading Software, I develop a collection of tailored trading indicators that cater to traders of all kinds, making sophisticated trading methods accessible and empowering traders to achieve consistent success.
I'm also deeply committed to education, conducting regular training sessions and live webinars where I share market insights and strategies. My teaching emphasizes disciplined trading and recognizing market confluence, equipping traders with the skills they need to succeed.
Additionally, I authored "Confluence not Coincidence", a book that delves into the critical concept of market confluence, offering traders a roadmap to recognize and capitalize on converging signals.
Click here to get your copy of "Confluence not Coincidence" and gain invaluable insights from a veteran trader.

Don’t just take my word for it…
See what others have to say about us:
Its been a crazy week, after microsoft earnings and the way nas closed on Wednesday with such a bullish move I was really bullish on the nas so I was just looking for longs, on thursday morning in the premarket and I had a monster trade. Caught a six star buy breaking the c pivot of a bat pattern. My stop was below the d pivot. I held it until the close for over 300 points. It just ran best trade I have ever had.
— Pedro E
“There is no magic bullet in trading, but the products offered by GTS are the closest things to it. They give you a great framework from which you can build on, whether you are just starting out or if you already have experience and are looking for another edge.”
— Tom, GTS Client
“Within a few weeks, I was hitting my weekly targets days on Mondays and Tuesdays some weeks instead of Fridays!”
— Nathan Shephard, CEO, Southern Sky Recovery
“Yes, I have made mistakes and losses, but that is the nature of the beast so to speak. However, the software does exactly what it says on the box and even with my limited knowledge, and with a bit of a learning curve, i am getting results.
I’ve had other software packages from various companies in the past which worked, but for me personally, this package ticks all the boxes.”
— John Davies, GTS Client
Scroll
Copyright © 2024 Global Trading Software. All Rights Reserved
Terms of Services | Privacy Policy | Cookie Policy | Risk & Hypothetical Performance Disclosures